
Quick Takes
- Stocks Rise. U.S. stock indices were higher in July as agreements on trade, positive economic data and strong earnings boosted shares. The S&P 500 rose by 2.4% while the Nasdaq 100 rose 3.3% and the Magnificent 7 rose nearly 8%. The Dow Jones Industrial Average fell 0.7% in July.
- Inflation and Interest Rates. The 10Y treasury yield rose in July to 4.4% as President Trump signed his Megabill into law on July 4. The bill extends the 2017 tax cuts, introduces deductions for tips and overtime, cuts Medicaid, and boosts spending on the military and immigration enforcement.
- Meme Stocks Rally. July was a month of meme stock euphoria as retail traders increased bets on speculative stocks like Kohl’s Corp. and Krispy Kreme Inc. These bets are often made because social media personalities promote the stocks. Here is our video on the topic.
- Texas Flooding. The Guadalupe River flooded in Kurr County, Texas as torrential rains caused the level of the river to rise sharply. Parts of the Hill Country, a rural area of about 20 counties west of Austin, were devastated with hundreds of residents killed or missing.
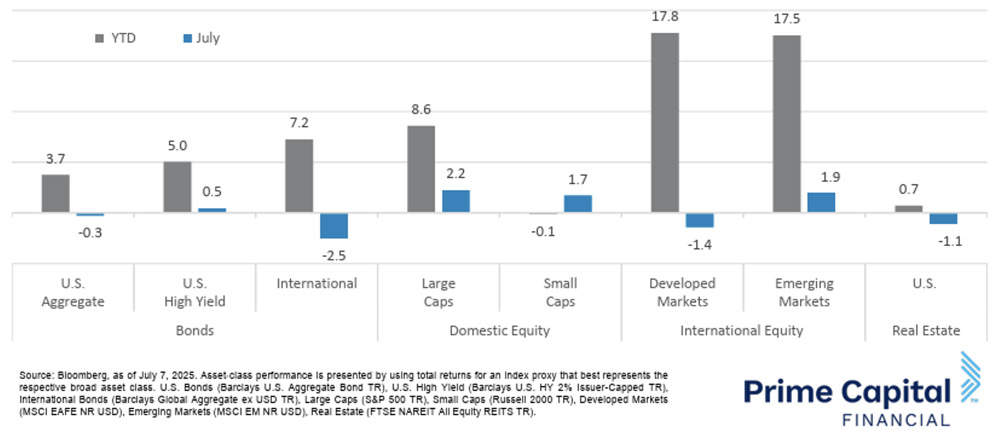
Asset Class Performance
Large caps outperformed small caps in July. U.S. stocks outperformed developed international stocks, as economic data and earnings boosted investor confidence. U.S. and emerging market equities were higher in July while bonds and real estate were generally lower.
Markets & Macroeconomics
Retail sales rose in June by 0.6% month-over-month, far exceeding consensus forecasts of a 0.1% bump as consumers spent more on a variety of goods and services including cars and car parts, food and beverage services, clothes, and building and garden materials. Consumers also indicated that they felt better about the economy in July than in June as both the Conference Board Consumer Confidence Index and the University of Michigan Consumer Sentiment Index rose from their May levels and came in ahead of expectations for the month.
There were also positive sign in the manufacturing sector as durable goods orders and factory orders grew in line with expectations in May and industrial production grew in June by 0.3% month-over-month. Despite some positive trends in consumer data, July’s labor and inflation releases were more mixed. Nonfarm payrolls grew in June by 147K jobs, which was ahead of the expected 106K positions and May’s print of 139K, a solid clip. Initial jobless claims also fell throughout the month from 233K in the first week of the month to just 218K in the final week. Unemployment also fell during the month from 4.2% to 4.1%. Private payrolls, however, came in below expectations at 74K versus the forecasted 100K and May’s print of 140K. Hiring in manufacturing was even weaker as the sector shed 7K jobs versus the 2K decline that economists had expected. This was after an 8K decline in May.
The labor force participation rate also declined slightly from 62.4% in May to 62.3%. Job openings also declined from 7769K at the beginning of the month to 7437K at the end of the month. On the inflation side, June CPI rose to 2.7% from May’s 2.4% on accelerating food, medical care, and household supplies prices. Core CPI and Core PCE also rose slightly from 2.8% to 2.9% and from 2.7% to 2.8% respectively. At their July 30 meeting, the FOMC decided to keep their policy rate at 4.25%-4.5% despite some committee members dissenting in favor of a 25-bps cut. The U.S. trade balance rose in May after falling sharply in April as tariff delays made imports more feasible for companies.
Bottom Line: The Fed continued to maintain its policy rate at its July meeting. Consumers spent more during the month and consumer sentiment readings improved. Despite the positive sentiment and spending growth, higher inflation and certain labor market data could create some challenges through the rest of 2025.
Download the Full Month in Review Report:
©2025 Prime Capital Investment Advisors, LLC. The views and information contained herein are (1) for informational purposes only, (2) are not to be taken as a recommendation to buy or sell any investment, and (3) should not be construed or acted upon as individualized investment advice. The information contained herein was obtained from sources we believe to be reliable but is not guaranteed as to its accuracy or completeness. Investing involves risk. Investors should be prepared to bear loss, including total loss of principal. Diversification does not guarantee investment returns and does not eliminate the risk of loss. Past performance is no guarantee of comparable future results.
Source: Sources for this market commentary derived from Bloomberg. Asset‐class performance is presented by using market returns from an exchange‐traded fund (ETF) proxy that best represents its respective broad asset class. Returns shown are net of fund fees for and do not necessarily represent performance of specific mutual funds and/or exchange-traded funds recommended by the Prime Capital Investment Advisors. The performance of those funds June be substantially different than the performance of the broad asset classes and to proxy ETFs represented here. U.S. Bonds (iShares Core U.S. Aggregate Bond ETF); High‐Yield Bond (iShares iBoxx $ High Yield Corporate Bond ETF); Intl Bonds (SPDR® Bloomberg Barclays International Corporate Bond ETF); Large Growth (iShares Russell 1000 Growth ETF); Large Value (iShares Russell 1000 Value ETF); Mid Growth (iShares Russell Mid-Cap Growth ETF); Mid Value (iShares Russell Mid-Cap Value ETF); Small Growth (iShares Russell 2000 Growth ETF); Small Value (iShares Russell 2000 Value ETF); Intl Equity (iShares MSCI EAFE ETF); Emg Markets (iShares MSCI Emerging Markets ETF); and Real Estate (iShares U.S. Real Estate ETF). The return displayed as “Allocation” is a weighted average of the ETF proxies shown as represented by: 30% U.S. Bonds, 5% International Bonds, 5% High Yield Bonds, 10% Large Growth, 10% Large Value, 4% Mid Growth, 4% Mid Value, 2% Small Growth, 2% Small Value, 18% International Stock, 7% Emerging Markets, 3% Real Estate.
Advisory products and services offered by Investment Adviser Representatives through Prime Capital Investment Advisors, LLC (“PCIA”), a federally registered investment adviser. PCIA: 6201 College Blvd., Suite#150, Overland Park, KS 66211. PCIA doing business as Prime Capital Wealth Management (“PCWM”) and Qualified Plan Advisors (“QPA”). Securities offered by Registered Representatives through Private Client Services, Member FINRA/SIPC. PCIA and Private Client Services are separate entities and are not affiliated.
© 2025 Prime Capital Investment Advisors, 6201 College Blvd., Suite #150, Overland Park, KS 66211.